Web Design Hampshire by Hotbox Studios


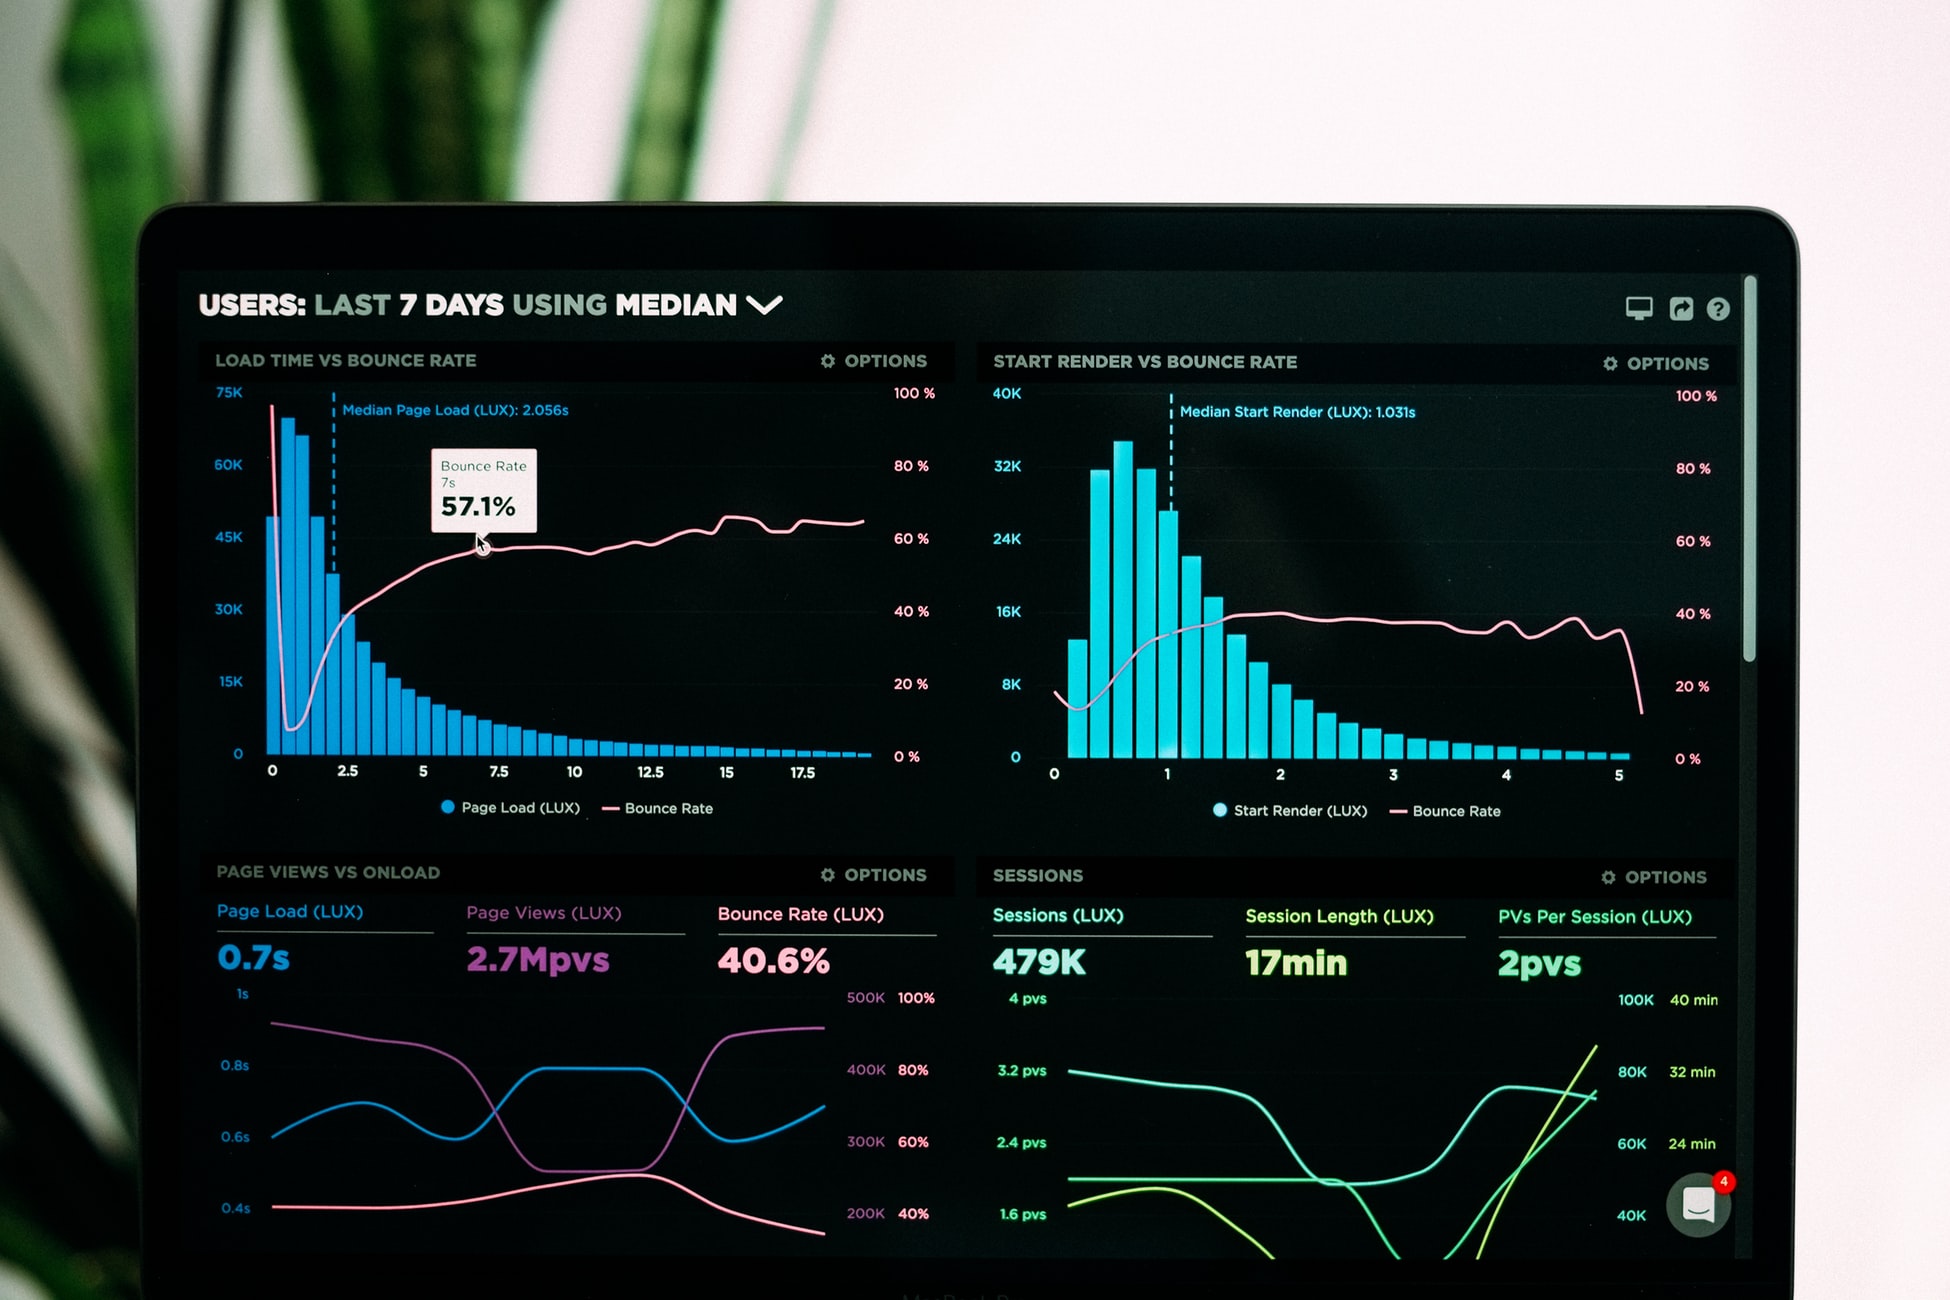
In addition to providing data extraction and transformation services, we also work with data visulisation tools to better deploy data to your business users and can offer various services to assist with your visualisation project.
Simply put, amoungst other features, a data visualisation will allow you to see defined data issues or trends etc. in a visual format 'at a glance' rather than requiring you to look through a page of numbers...

For example, within a visualisation, you could specify that any underperforming vendors you deal with, based on delivering on time, be highlighted in ‘Red’ so that you can immediately pick them from a list (based on your own defined metric) and take action
Equally, you could create a graphic that shows your customers as icons on a size scale - from large (best customers) to small (worst customers) based on the revenue that they generate, but then apply a colour from Red (Poor) to Green (Good) relative to the margin percentage that applies to their generated revenue – Allowing you to visually see where your customers are providing high value sales and a good profit margin, or where the opposite is true and remedial action may be required.

These tools will also allow deployment of reports through mobile devices, PC / Tablet etc. so are a very flexible platform for data access within your business, or for those who may be on the road or based remotely.
For more information, or to arrange a demonstration, please get in touch as ‘seeing’ a visual tool will be the best way to understand the benefits that it can offer.
GET IN TOUCH
